Navigating the Vast EIA Data Sets
The Energy Information Administration (EIA) is an independent arm the Department of Energy (DOE) that is tasked with surveying, analyzing, and disseminating all forms of data regarding energy in the United States. Further, EIA is a politically isolated wing of the DOE– meaning it is there to provide independent and factual data and analysis, completely independent from the partisan decision makers in Washington or the political inclinations of those in charge of at the top of DOE. Because that is the case, you can be confident the data put out by EIA is not driven by any agenda or censored in favor of a desired conclusion.
Thus for anyone with even a passing interest in the national production and use of energy, EIA really is a treasure trove of valuable information. However, those who are unfamiliar with navigating the EIA resources can easily get overwhelmed by the vastness of the data at their fingertips. Additionally, even seasoned veterans of the federal energy landscape might find it difficult to find the exact piece of data for which they are digging within the various reports and data sets made publicly available on the EIA website. So regardless of your experience level, what follows is a brief guide to what type of information is available as well as some advice as to how to make the best use of your time surfing around EIA.gov.
Types of data available
One of the really fabulous things about the EIA data sets is that they cover every kind of energy you can imagine. The energy categories you can focus into include, but are not limited to, the following:
Petroleum & other liquids (including crude oil, motor gasoline, heating oil, propane, natural gas liquids, and more)
Renewables (including solar, wind, geothermal, hydropower, biofuels, and more)
Within these energy categories, you can look at the trends of production, consumption, imports/exports, and carbon dioxide emissions going back years (oftentimes even decades) and also modeled as a forecast into the coming years. Most data sets will have tools to automatically manipulate the data to change between units (e.g., total barrels of oil vs. barrels of oil per day), or even manipulate data trends (e.g., go from weekly data to 4-week moving averages to 10-year seasonal averages). Depending on the type of data, these numbers are regularly updated weekly, monthly, and/or yearly. If there’s a topic of particular interest, there’s a good chance there’s a report with the data on it being released at regular intervals– some of the more prominent reports are highlighted below.
Regularly updated reports
EIA releases a regular stream of reports that serve to update the publicly available data at given intervals. Some of the more prominent reports are listed below, and they are typically used to update all of the energy categories previously mentioned:
The Monthly Energy Review (MER) is a fairly comprehensive report on energy statistics, both from the past month and historically back a number of decades. Published during the last week of every month, the MER includes data on national energy production, consumption, and trade across petroleum, natural gas, coal, electricity, nuclear, renewables– as well as energy prices, carbon dioxide emissions, and international petroleum.
The Short-Term Energy Outlook (STEO) is another monthly EIA report, this one released on the first Tuesday following the first Thursday of the month. The STEO includes data on much the same topics as the MER, with the inclusion of some international energy data, and it also includes monthly and yearly projections for the rest of the current year and all of the next year based on EIA’s predictive models. The inclusions of these forecasts makes for particularly useful data sets for anyone who might be trying to stay a step ahead of the energy markets. Also of particular interest for statistically-minded people out there is a regular comparison of numbers between the current STEO forecast and the previous month’s forecast. These comparisons show which way the model shows data to be trending, with the more significant ones called out in the report and noted with reasoning behind the changes.
The Annual Energy Outlook (AEO), like the STEO, provides modeled projections of energy markets– though the AEO focuses just on U.S. energy markets, models these annual forecasts long-term through the year 2050, and is released every January. The other aspect of the AEO that makes it particularly interesting is that its modeled forecasts, in addition to a reference case forecast, include different assumptions on economic, political, and technological conditions and calculate how those various assumptions might affect the outlook. For example, the 2017 AEO includes projections based on high economic growth vs. low economic growth, high oil price vs. low oil price, high investment in oil and gas resources and technology vs. low investment, and a projection that assumes a complete roll-back of the Clean Power Plan.
The International Energy Outlook (IEO) provides forecast energy market data consistent with the AEO, but regarding the international energy market through 2040.
With forecasts in both the STEO and the AEO, an understanding of exactly what is meant by the forecasts is imperative. The forecasts and projections do not necessarily reflect what a human prognosticator within EIA thinks could, should, or will happen– rather it demonstrates what the predictive models calculate given the best possible and unbiased inputs available. This difference is a subtle one, but if you ever find yourself questioning “does the person behind this report really think this is going to happen?”, recognize that some nuance exists and the reason you are skeptical might have not yet been able to be statistically included in the model.
The State Energy Data System (SEDS) is published once annually and breaks down national energy use, price, spending, and production by sector and by individual states. Within each of these categories, you can also break down the data by energy type (e.g., coal vs. natural gas) and by primary energy use vs. electric power generation. Having this granularity is useful to further dig into if certain energy trends are regional, restricted to certain climates, or are in response to specific state policies.
While they are not necessarily releasing new and specific data on a regular basis, two other EIA articles of note are worth pointing out because of the interesting stories and analyses they tell:
Today in Energy (TIE) comes out every weekday and gives a quick and readable article with energy news, analyses, and updates designed to educate the audience on the relevant energy issues. TIE frequently features graphs and charts that elegantly demonstrate the data in an easy to understand but also vastly elucidating way. One of the real advantages to reading TIE each day, though, is they often include tidbits from all the previously mentioned regularly updated reports, as well as other major releases or EIA conferences, enabling you to keep up with the newest information from EIA (click here for a post on the best TIE articles of 2017 to get you started).
This Week in Petroleum (TWIP) is an article that comes out every Wednesday that is very similar to the TIE articles, but focuses on the world of petroleum specifically and provides crucial insights on topics such as drilling, oil company investments, retail prices, inventories, transportation of crude and refined petroleum products, and more.
If any of these regular reports are of interest to you, you can sign up to get email alerts anytime these (or a number of other) reports are released by EIA by visiting this page. If you don’t know which reports you’d want but you want to keep an eye on what EIA is putting out, you can also simply subscribe to the “This Week at EIA” list that will once a week send you an email to notify you of ALL the new EIA productions from that week.
Finding specific data
While keeping up with all the regular reports from EIA is immensely useful, what brings many people to the EIA website is the search for a specific piece of data. You might want to see a history of average gasoline prices in a certain region of the country, find the projection of how much solar capacity is expected to be added in the next few years, track how much petroleum product is being refined in the Gulf Coast, or countless other facts and figures. Below you’ll find a few strategies you can employ to track down the information you seek.
Navigating the menus
EIA.gov has a useful menu interface through which you can usually navigate to your desired dataset easily.

Source: Homepage of EIA.gov
The “Sources & Uses” drop down will be where you can navigate to data sets about specific fuel sources and energy use;
The “Topics” drop down highlights the analysis on data by EIA as well as economic and environmental data; and
The “Geography” drop down is where you can navigate data by state or look at international data.

Source: Homepage of EIA.gov
Navigating from these menus is fairly self-explanatory, but let’s walk through the example of finding the recent history of gasoline prices in the Gulf Coast region of the United States. Gasoline is a petroleum product, so we would click on “Petroleum & Other Liquids” under the “Sources & Uses” menu.
Once on the “Petroleum & Other Liquids” page, the information we’re interested in would be under the data menu with the “Prices” link.

Source: Landing page for EIA.gov/petroleum
You’ll then see a listing of various regular releases of petroleum product price reports and data sets. Since we’re interested in Gulf Coast gasoline prices, we’ll click the third link for “Weekly retail gasoline and on-highway diesel prices.”

Clicking on this report will bring up the below interactive table. The default view will be to show U.S. prices averaged weekly. The time frame can be adjusted to monthly or annual prices (we’ll keep it at weekly). The location of the prices can be changed to allow viewing of data by region of the country or by select states and cities (we’ll change it to the Gulf Coast). The interactive table then displays the most recent week’s data as well as the previous five weeks (note: for ‘gas prices’ as is most often reported in the media and related to people filling up the gas tanks in their cars, we’re interested in the row titled ‘Regular’).

If you’re interested in going further back in time then shown in the interactive table, the ‘View History’ links can be clicked to bring up an interactive table and graph going as far back as EIA has data (1992, in this case), shown below. Alternatively, if you want to have the raw data to manipulate yourself in Microsoft Excel, then click the ‘Download Series History’ link in the upper left (I’ll download and keep this data, perhaps handy for later in this post).

Note in the above interactive chart there is the built-in abilities to view history by weekly/monthly/annual data, to download the source data, or the adjust the data to be a moving average or seasonal analysis.
If you find a page with the type of information you’ll want to reference regularly or check in on the data as they update, be sure to bookmark the URL for quick access!
STEO Custom Table Builder
Another useful tool is the STEO Custom Table Builder, which can be found here. The Custom Table Builder allows you to find all of the data that is included in the monthly STEO report (e.g., U.S. and international prices, production, and consumption for petroleum products, natural gas, electricity, coal, and renewable energy; CO2 emission data based on source fuel and sector; imports and exports of energy commodities; U.S. climate and economic data broken down by region; and more). This data can be tracked back to 1997 or projected forward two years on a monthly, quarterly, or annual basis. All you need to do is go to the Custom Table Builder, shown below, and select the options you wish to display.

Source: EIA’s Custom Table Builder
As an example, let’s use the STEO Custom Table Builder to determine the projected of how much solar power capacity in the near term. Solar would fall under the ‘U.S. Renewable Energy’ category, so click to expand that category, then expand the ‘Renewable Energy Capacity,’ and you’ll see the STEO has data for data for the capacity of large-scale solar for power generation, large-scale solar for other sectors, and small-scale solar for other sectors.
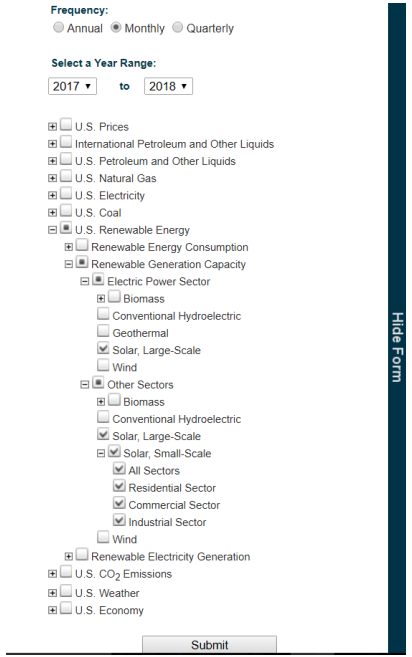
Source: EIA’s Custom Table Builder
Select all the data relevant to solar data, select the years you want (we’ll look at 2017 thus far through the end of 2018), and what frequency you want the data (we’ll look at monthly). Then hit submit, and the following will be the custom table built for you.

Source: EIA’s Custom Table Builder
Note: The forecast data is indicated in the Custom Table Builder with the numbers shown in italics. The above data was pulled before the September 2017 STEO was published, so the projections begin with the month of August 2017.
For this example, we’ll want to then download all the data to excel so the total solar capacity can be added up and analyzed. Click the ‘Download to Excel’ button at the upper right to get the raw data, and with a few minutes in Microsoft Excel you can get the below chart:

Source of Data: EIA.gov, pulled on September 10, 2017
This graph, made strictly from STEO Custom Table Builder data, shows the following:
As of July 2017, large-scale solar generation capacity was only 0.3 GW outside of the power sector and 23.7 GW, while small-scale solar generation capacity was 14.8 GW.
Together, solar power capacity in the United States added up to 39.1 GW as of July 2017.
By the end of 2018, total solar power capacity is projected to rise to 53.7 GW (an increase of 14.5 GW, or 37%), according to the EIA’s August 2017 STEO.
Search function
Using a search bar on some websites can be surprisingly frustrating, but luckily the EIA search function is very accurate and useful. So, I have found that, when in doubt, simply doing a search on EIA.gov is the best option.
Perhaps I want to track the amount of petroleum products in production on the Gulf Coast. This information is not in the STEO report, so the Custom Table Builder won’t be of use. And maybe I don’t immediately see how to navigate to this specific information on the menus. I would type into the search bar the data I’m seeking as specific as possible—‘weekly gulf coast refiner gasoline production’:

Source: EIA.gov
Click on that first link, and ta-da! We’re taken to the weekly gasoline refinery report for the Gulf Coast (referred to as PADD 3). Again, you see the options here to look at the history back to 1994 both on a weekly and a 4-week average basis, use the chart tools to analyze moving averages or seasonal analyses, or download the data to utilize in your own way.

Contact experts
As a last resort, the EIA website offers resources to contact should you have questions or issues navigating the data. The people behind the EIA data are civil servants who are intelligent and very dedicated to their job and making sure you get the accurate and relevant information you need. So in a pinch, head to the Contact Us page and find the topic on which you need help from a subject matter expert.
If you want an alternative to going straight to the people at EIA, however, feel free to contact me as well and I’d be happy to try and help you track down information on EIA.gov as well. Use any of the contact methods mentioned in the Contact Page of this site, or leave a comment on this post.
Using the data
I have found that it is not at all an exaggeration to say that the world (of energy data, at least) is at your fingertips with EIA’s publicly available data. To demonstrate, I’ll walk through a quick example of what you can find.
If we take the previously gathered weekly data for Gulf Coast gasoline prices and gasoline production, we can plot them on the same graph:

Source of Data: EIA.gov, pulled on September 10, 2017
By taking advantage of the publicly data on EIA’s website, we can notice some trends on our own. In the above, there is a drastic increase in Gulf Coast gasoline prices, coincident with a large decrease in Gulf Coast refiner production of gasoline that bucks the month-long trend of production generally increasing. This is a curious change and would prompt investigation as to the reason why. Luckily, several of EIA’s Today in Energy articles already points out this trend and offers explanation—all related to the effects of Hurricane Harvey on the Gulf Coast petroleum systems (Article 1, Article 2, Article 3). Just goes to show that one of the best way to stay abreast of trends and information in the energy world is to follow EIA’s various reports and analyses.