Petroleum Administration for Defense Districts (PADDs): Past and Present
If you’re an energy-statistics nerd (which you probably are if you’ve found your way to this blog), you’ve no doubt seen various regional data expressed by PADD, or Petroleum Administration for Defense District. Referring to barrels of oil sent from one PADD to another or which PADD uses certain fuel types for home heating allows for a useful shorthand for regions of the United States and their energy related statistics. Many people who come across the PADD system might already understand PADDs to be a bygone classification system from the country’s fuel rationing days, but most people’s understanding of the PADD system stops here and the history of PADDs are not explored any further.
That’s where this article comes in! This piece will serve to explain what the PADDs are, where they originated, how they evolved over the years, and how they are relevant today.
What are PADDs?

Petroleum Administration for Defense Districts, or PADDs, are quite simply the breaking down of the United States into different districts.
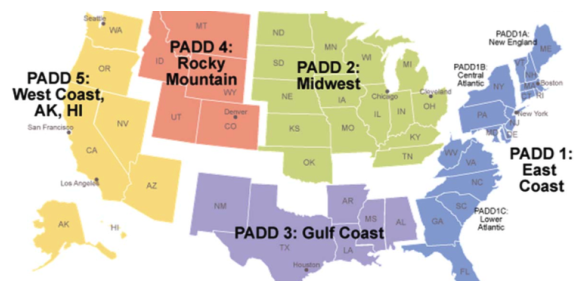
PADD 1 is referred to as the East Coast region and, because of its size, is further divided into three subdistricts:
PADD 1A, or New England, comprises Connecticut, Maine, Massachusetts, New Hampshire, Rhode Island, and Vermont;
PADD 1B, or Central Atlantic, comprises Delaware, the District of Columbia, Maryland, New Jersey, New York, and Pennsylvania; and
PADD 1C, or Lower Atlantic, comprises Florida, Georgia, North Carolina, South Carolina, Virginia, and West Virginia.
PADD 2 is referred to as the Midwest region and comprises Illinois, Indiana, Iowa, Kansas, Kentucky, Michigan, Minnesota, Missouri, Nebraska, North Dakota, South Dakota, Ohio, Oklahoma, Tennessee, and Wisconsin.
PADD 3 is referred to as the Gulf Coast region and comprises Alabama, Arkansas, Louisiana, Mississippi, New Mexico, and Texas.
PADD 4 is referred to as the Rocky Mountain region and comprises Colorado, Idaho, Montana, Utah, and Wyoming.
PADD 5 is referred to as the West Coast region and comprises Alaska, Arizona, California, Hawaii, Nevada, Oregon, and Washington.
New PADDs
There are also two additional PADDs after the original five PADDs that rarely get mentioned, likely because they are much newer and the volume of oil products going in and/or out of them are minimal compared with the rest. Despite a mention of them in the Energy Information Administration‘s (EIA) write up of the PADD system, PADDs 6 and 7 (meant to cover U.S. territories around the world) do not have data on them included on the prominent, publicly-facing EIA data sets. However, some digging shows that PADD 6 was added in 2015 in order to properly report needed information to the International Energy Agency and comprises the U.S. Virgin Islands and Puerto Rico, while PADD 7 includes Guam, American Samoa, and the Northern Mariana Islands Territory. You will commonly find sources citing just five total PADDs, but don’t let that throw you off. Simply impress those you meet at energy cocktail parties by memorizing what territories are in PADDs 6 and 7.
Origin of PADDs
The federal government first established the regions that would become the five PADDs during World War II. Specifically, the Petroleum Administration for War was established as an independent agency by Executive Order 9276 in 1942 in order to organize and ration the various oil and petroleum products to ensure the military had all the fuel it needed. Part of that organization process was the establishment of these five districts as a tool for that goal. The Petroleum Administration for War ended in 1946 after the war efforts were over, but these five original districts were quickly reestablished by the successor Petroleum Administration for Defense that was created by Congress in 1950 in response to the Korean War. This Administration provided these districts with the name Petroleum Administration for Defense Districts.

Source: Ames Historical Society
Changes over time
As stated, the original function of the PADDs was to ensure proper distribution of oil supplies during World War II. In fact, the Department of Defense made use of the PADD system to redirect oil resources to specific PADDs in response to Nazi attacks on U.S. tankers. These oil distribution efforts were the largest and most intricate such efforts yet, leading to the realization that interstate pipelines would soon become necessary to connect oil refineries with distant U.S. markets. But once World War II ended, the government determined there was no more need for the Petroleum Administration for War, and gone with the Administration were the districts.
After the Petroleum Administration for Defense revived the five districts, they were then under the management of the Department of Interior’s Oil and Gas Division, with the continued function to ensure the oil needs of the military, government, industry, and civilians of the United States were met. As with the Petroleum Administration for War, the Petroleum Administration for Defense was short-lived and was abolished just four years later by the Secretary of the Interior’s Order 2755 in April of 1954. Even though the government agency was eliminated, the names and organization of the various PADDs continued to be used ever since.
One significant change over the history of PADDs that is important to note is that there are no present day ‘official’ government keepers. While the PADDs served an official function and thus had official definitions set out by government agencies during World War II and the Korean War, that is no longer the case today– but that does not mean they are no longer significant. Within the Department of Energy (DOE), EIA uses the PADDs extensively in its aggregation and dissemination of data (discussed in more detail next). Further, government agencies have defined PADDs for use within specific regulations. For example, theEnvironmental Protection Agency (EPA) codified PADDs in the Code of Federal Regulations (CFR) when regulating motor vehicle diesel fuel sulfur use (though it explicitly dictates that the definition is only applicable as codified for that specific regulation) and specified total benchmarks and reductions that were to be met PADD-wide, as well as in reporting requirements regarding fuel additives so that they get published by PADD.
Use of PADDs today
With the government being out of the business rationing oil and petroleum since the end of the Korean War, the PADDs have found new purpose. The same PADDs have survived to allow analysis of data and patterns of crude oil and petroleum product movements within (and outside) the United States. Using these PADDs, government and industry players are able to ensure they are using the same regional collection of states and shorthand language to analyze and spot trends within regions instead of being confined to looking at the nation as a whole or analyzing on a more state-by-state basis.
Further, the PADDs are separated in a way that makes analysis straightforward. For example, following the crude supply in PADDs 2 and 3 are the most important to crude prices because they contain the largest number of refineries. Heating oil demand is mostly concentrated in PADD 1, making that the region to look at when investigating heating oil prices. Additionally, using the language of PADDs enable quick insights into data such as EIA noting the impact of Hurricane Harvey on flow of propane from PADD 2 to PADD 3 or detailing how PADD 1C needed to supplement its gasoline inventories with foreign imports when there was an accident that shutdown the pipeline that typically supplies the area with gasoline from PADD 2.

Examples of trends, statistics, and PADD characteristics
There are plenty of other examples of the usefulness of dealing with oil-related data within PADDs. A common example is to delineate from where different PADDs receive their oil. For example, with the knowledge that almost half of U.S. refining capacity is on the Gulf Coast (i.e., PADD 3) while less than 10% of refining capacity is on the East Coast (PADD 1) (though PADD 1 contains about one third of the U.S. population), an obvious conclusion is that there must be a lot of intra-PADD oil shipments everyday. In fact, about half of the oil consumed everyday by PADD 1 is supplied from PADD 3 over pipeline, rail, truck, and barge.
Going further, much of the commonly distributed data from EIA (click here to learn about the vast data available from EIA and how to navigate it all) utilizes PADDs. For example, EIA allows you to look at the following:
Weekly international imports and exports of petroleum products by PADD;
Movement of petroleum products between each PADD by pipeline, tanker, barge, and rail;
and much more.
So hopefully the next time you read a table from EIA that deals with oil movement specific to PADD 3 or read a news article citing the disruption of a pipeline that serves PADD 1, this article will come to mind and you’ll be better served to speak to it– and remember to try to win some bets with your knowledge of the seldom-mentioned PADDs 6 and 7!
If you enjoyed this post and you would like to get the newest posts from the Chester Energy and Policy blog delivered straight to your inbox, please consider subscribing today.
If you want to learn more about the various energy-related institutions keeping the industry humming, see this post on the Federal Energy Regulatory Commission, this post on the Strategic Petroleum Reserve, and this post on ARPA-E.
Sources and additional reading:
Crash Overview of U.S. PADDs and Why They’re Important
Do You Know What the PADD Does for the Oil & Gas Industry? Croft Production Systems
Records of the Petroleum Administration for War: National Archives