Making Energy Data A Breeze: The U.S. Wind Turbine Database

A few weeks ago, the U.S. Department of Energy (DOE) and the U.S. Geological Survey (USGS) announced the release of an online dataset and visualization tool of all wind turbines in the United States. This public facing tool allows anyone to view the comprehensive data of the location and characteristics of wind turbines, specifically being advertisedas being more easily accessible, more accurate, and more frequently updated than previous wind turbine datasets.
When large and comprehensive datasets are made available to the public, there is always much to digest when diving in. I was excited to spend some time poking around in the data and playing with the tools included for visualizing the wind turbine data, immediately seeing how useful it all was. As previously done in an article guiding how to navigate and utilize data from the Energy Information Administration (EIA), I wanted to offer a quick tour of the data that is now available at your fingertips and also show the type of questions regarding the U.S. wind power industry that are now easily answered using this data.
Exploring the dataset
Map view
The U.S. Wind Turbine Database can be accessed through this link. You will be greeted with the following view:

Source: U.S. Wind Turbine Database
This standard view shows you where in the United States there is a density of wind turbines, with green splotches representing high density of wind turbines and blue areas less dense, while no splotches mean there are no turbines. You can then adjust the map using the ‘apply range filter to turbines’ buttons to only show the density of turbines within a certain range of specifications:
Based on a specified height range of the turbines;
Based on a specified capacity range of the turbines; or
Based on a specified range for the year of installation (with the below view showing only the density for wind turbines installed since 2012).

Source: U.S. Wind Turbine Database
From there, you can also zoom in on specific parts of the map, choose to include or exclude turbines for which the data available is not complete, or even use the play button next to the year button to see a time lapse animation of wind projects getting installed over time.
The other important view from this map is switching from density heatmap to point locations, which replaces the density cloud of turbines to instead show a dot for every turbine in the given view. Depending on your selection, the dots can be color coded to indicate height, year of installation, or capacity (with the below view showing warmer red colors for the higher capacity turbines and the cooler blues for the smaller capacity turbines). This view similarly allows you to apply filters so only certain height, capacity, or year-of-installation turbines are displayed and also to zoom in on certain regions of the map.

Source: U.S. Wind Turbine Database
Below is the view you get when zooming in on a cluster of turbines, this one specifically for a region in Laredo, Texas. When zoomed in, you can see the number of projects that are in that zoomed-in view; highlight all the turbines that belong to a specific wind farm project; see the relative capacity, number of turbines, and year of installations; and see the separation between different projects in the same area. You can also see instances where the data is incomplete, such as below where the Unknown Webb County Project is forced to display a capacity of 0 megawatts (MW) because the real data is unavailable.

Source: U.S. Wind Turbine Database
Lastly, in point location mode you can also hover the cursor over a specific turbine on the map and see all the following details:

Source: U.S. Wind Turbine Database
Raw data
If you need more detailed data for your analysis, as opposed to just the provided visualization tool, the raw data of the U.S. Wind Turbine Database can be downloaded in ShapeFile, GeoJson, CSV, or XML. I use the CSV data in excel because that’s where I’m most comfortable working, but be careful because with over 57,000 rows of data it creates a behemoth of a spreadsheet that can seriously slow down your computer.
This dataset provides not only all of the information listed above when hovering over an individual wind turbine in the visualization, but some additional information, too. The full data available for each wind turbine includes the following:
Turbine location, listed by county, state, and latitude/longitude: Data includes turbines located in 43 different states plus Guam
Location confidence: Given the large size of this database and the various methods use to gather it, the exact location is reported with various amounts of confidence– from low to high
Project name (individual wind farm projects are the larger installations that come with many turbines): This dataset has over 1,500 projects included
Number of turbines: Includes how many turbines are included in the whole project, up to over 1,800 turbines in a single project
Turbine manufacturer and model: When available, the specific model of a turbine is listed
Year of installation: Starting in 1981 and going through 2017, with updates to be coming on a regular basis
Turbine capacity: Ranging from 40 kilowatts (kW) to 6 MW
Total project capacity: Up to almost 500 MW
Hub height: Measures from ground to the center of the rotor, ranging from 18 meters (m) to 117 m
Rotor diameter: Measures how wide of a diameter the rotors sweep, ranging from 11 m to 150 m
Total height: By definition, this measurement goes from the ground to the tip of the rotor when rotor is pointing straight up– all the way up to 181 m
Attribute confidence: Just like with location, the specific characteristics of the turbines are reported from low to high confidence based on the method of gathering the data
Pressing wind energy questions that can now be answered
Upon its release, a number of organizations noted that the U.S. Wind Turbine Database allowed for relevant study and analysis not previously possible, including impact assessments of wind turbines on radar, testing of wind facility impact on radar systems, and studying wind energy and wildlife interactions. But the best way to demonstrate the power afforded by the release of this database, in my opinion, is to show in action the types of questions you can now answer with ease using the tool.
Quora is a question-and-answer website that allows its community to seek out answers from experts to their every question. Often when typing a question into Google, the top answers provided will be the Quora page where that question has already been answered, and among its 100 million monthly visitors are experts in every field imaginable. I have taken to answering questions on Quora recently, even reaching the status of a ‘Most Viewed Writer’ in topics like Alternative Energy, Sustainable Technology, Solar Energy, and even Wind Energy. Though at time of writing this post I’m still pretty far down from the top spot, perhaps the answers drafted for this article will serve to bump me up– now that I’m equipped with the U.S. Wind Turbine Database!

Source: Quora
Where is the largest wind turbine?
This question can be answered in three different ways by the U.S. Wind Turbine Database: the greatest capacity, the greatest rotor diameter, and the greatest total height. Unsurprisingly, the answer to all three (in the United States, at least) is the same.
The Block Island wind project off the coast of Rhode Island has five turbines, each setting the bar for greatest capacity (6 MW), height (181 m), and rotor diameter (150 m).

Source: U.S. Wind Turbine Database

Source: Block Island Reservations
However, it is important to note this database is only dealing with turbines in the United States. Expanding to the whole globe, off the shores of Scotland there sit 8.8 MW wind turbines standing 191 m tall with rotors 60 meters in diameter. Following quickly (but not yet installed) are the development of 9.5 MW offshore wind turbines that will stand 187 m tall with rotors of 160 m in diameter to be deployed in offshore wind farms in Britain, and a few years later will bring 12 MW turbines that stand 260 meters tall with rotor diameter of 214 meters.
How much electricity is generated by a wind turbine?
The immediate and obvious response here is that the answer varies greatly by the size of the turbine, as well as how consistently the wind blows in the area of the turbine and how efficient the particular turbine is at generating electricity. However, using the U.S. Wind Turbine Database, we can come up with a range and average of the capacity of wind turbines.
The wind turbine in the United States with the lowest rated capacity for power generation is rated for 40 kW. There are 80 such turbines in the Enertech project in Alameda County, California.

Source: Wind Turbine Models
The wind turbine in the United States with the greatest rated capacity for power generation, as previously mentioned, is rated for 6 MW– this is the rated capacity of each of the five turbines in the Block Island Project in Washington County, Rhode Island.
Counting the almost 55,000 turbines in the U.S. Wind Turbine Database that have capacity data included, the average rated capacity in the United States is 1,633 kW. Obviously this rated capacity does not translate directly to electricity generated on a given day, since you would also need to know the capacity factor of the wind turbines to know how often wind gets translated into power, but knowing the average U.S. wind turbine is rated for 1,633 kW means you can expect it to be generating 1,633 kW of power when the wind is cooperating.
Why don’t the former Confederate States produce wind energy?
I’m not sure why the person asking this question chose specifically the former Confederate States instead of a broader identification of southern states, but I’m going to answer the question literally and look at wind turbines in the states that formed the 11 Confederate States of America: South Carolina, Mississippi, Florida, Alabama, Georgia, Louisiana, Texas, Virginia, Arkansas, Tennessee, and North Carolina.
Going back to the map-view of the United States as a whole, it is clear to see the trend this question is referencing:

Source: U.S. Wind Turbine Database
Across the American South, there appear to be little to no wind turbines in each state. Exactly how many can be found in the former states of the Confederacy? By going through the raw data, the following numbers are found:

Note: I didn’t think an innocent article about wind turbines was the right place to wade into the politics of using a Confederate flag for the background image of this table. But I really like background images in my tables, so please accept these Confederate soldiers who appear to be looking around asking “Hey, where are all the wind turbines?” Also note that Florida is listed as having one turbine but a total capacity of 0 kW— this is because the capacity of that one turbine was not available in the U.S. Wind Turbine Database.
We can then compare that result with the same data for the Union States (I’m just assuming the person asking the question was wondering about the interplay between the Civil War and wind energy…) of Maine, New York, New Hampshire, Vermont, Massachusetts, Connecticut, Rhode Island, Pennsylvania, New Jersey, Ohio, Indiana, Illinois, Kansas, Michigan, Wisconsin, Minnesota, Iowa, California, Nevada, and Oregon (ignoring the five Border States):

Note: These Union soldiers are clearly standing with confidence, fully aware of the wind turbines that will dot their states in about a century and a half.
The contrast between the Union States and the former Confederate States is clear. While Texas has the most turbines and the greatest total capacity of any of the states listed and North Carolina outpaces the lower third of the Union States, the former Confederate States otherwise have a paltry showing in wind energy today. Individually, 13 out of the 20 Union States have more wind turbines and total wind capacity than the combined 10 non-Texas Confederate States. This fact can be further confirmed by looking at EIA data, specifically the detailed electricity generation data broken out by energy source and state:

As the generation data shows, the lack of wind turbines outside of Texas means that the rest of the former Confederate States have meager wind energy generation. Comparing the energy mix of the former Confederate States with the Union States shows that the lack of wind (as well as less coal, hydroelectric, and solar power) is compensated with a greater portion of natural gas.
However this only explains where the power comes from, not why it doesn’t come from wind. Well, the answer, it turns out, is extremely simple. Wind energy only works in areas where the wind blows at sufficient speeds on a consistent basis. Looking at the below map of wind speeds across the United States, it becomes evidently clear why wind energy is concentrated in most areas of the country except the South.
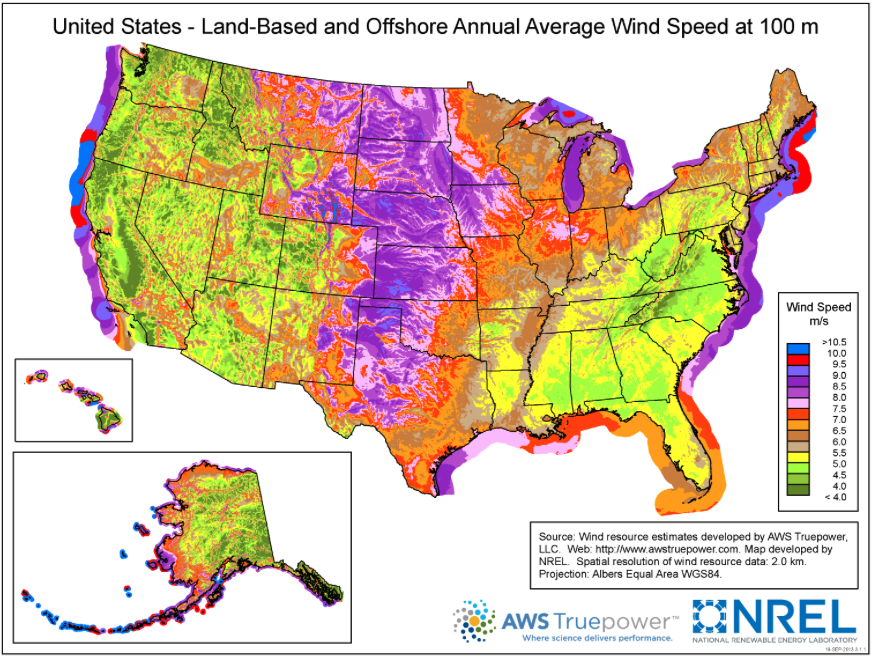
Source: NREL
How many wind turbines would there be in a 200-MW wind farm project?
This question is another one that immediately has to be qualified with ‘well that depends on a lot of factors,’ which makes for a rather unsatisfying answer. However, the U.S. Wind Turbine Database allows for real examples of how many wind turbines are in U.S. wind farm projects that are about 200 MW in capacity. To start with, we can use the raw data to generate a plot of total capacity vs. the number of turbines for each of the over 1,300 wind projects in the United States with full data for capacity and turbine count:

Intuitively, the shape in which this data falls makes sense. Each diagonal line extending out from near the origin of the graph represents a group of wind projects that use wind turbines with the same capacity but with varying total turbine counts, meaning the slope of those lines correlates with the capacity of the individual turbine. The two horizontal lines represent where 200-MW wind projects fall, plus or minus 10% (i.e., 180 to 220 MW). Zooming in on that area shows the following:

When focusing on this 200-MW plus/minus 10% area, the range of the number of turbines used goes from a low of 56 turbines (each 3.3 MW for a total of 184.8 MW) to a high of 209 turbines (each 1 MW for a total of 209 MW). On average, though, a wind farm with 200 MW in total capacity would require about 111 turbines, each with a capacity of 1.9 MW, according to existing wind turbine projects across the United States.
What is the length and diameter of blades and rotor in small wind turbines?
Finishing up on a relatively simple one, we can look at the smallest wind turbines in the database to answer this question.
The lowest capacity turbine in the U.S. Wind Turbine Database is, once again, a 40 kW turbine in the Enertech project in California. The rotor diameter of this turbine is 13 m, meaning the blade length is about 6.5 m.
However that does not represent the smallest rotor in the database. A 65 kW turbine in the San Jacinto Power Company project in California has a rotor diameter of just 11 m, meaning its blade length is about 5.5 m.

Source: Wikicommons
Are there any other wind-related questions you have that you want Chester Energy and Policy to investigate using the U.S. Wind Turbine Database? Let me know in the comments!
If you enjoyed this post and you would like to get the newest posts from the Chester Energy and Policy blog delivered straight to your inbox, please consider subscribing today.
To see other posts taking deep dives into energy data, see this post on electricity demand during a federal government shutdown, this post analyzing economics issues surrounding clean coal, and this article analyzing the costs of leisure driving through the years.