Federal Government Shutdown: Analyzing Electricity Demand When Government Workers Get Furloughed in Washington DC

In a dance that’s become a bit too commonplace in the federal government, threats of a government shutdown over political differences and budget issues are looming once again. After multiple continuing resolutions agreed to between Democrats and Republicans, the latest deadline for appropriation bills to fund the government is fast approaching. While a potential government shutdown would put my 9-5 job on hold until a resolution was reached, a frustrating prospect for all families who rely upon paychecks from their government jobs, there’s not much to do for those of us outside of the White House and Congress. What I can do with that nervousness, though, is ask energy-related questions!
The fact that energy and electricity use changes at regular intervals throughout the day and week is well established, and these trends are reliably correlated with the day of the week, time of the day, and weather. Knowing this led me to the question of how a government shutdown would effect the electricity demand in the Washington DC area, where over 14% of the workforce is made up of federal employees. Would a government shutdown lead to an electricity demand closer to a typical weekend day than a weekday because of the large amount of people who would no longer be reporting for work? Would the overall electricity demand go up or down? Is any of this even noticeable, given that about 86% of the workforce would be going to work as normal? We are only four years removed from the last federal government shutdown, so looking at the electricity demand surrounding the 2013 shutdown can provide some insight as to what might happen if there is a shutdown this time around.
Background
The 2013 federal government shutdown lasted from October 1 through October 16, with President Obama signing a bill to reopen the government shortly after midnight on October 17. The political football at stake in 2013 was the Affordable Care Act, as Republicans in Congress sought to defund the program while the Democrats refused to pass funding bills that would do so. As a result, nearly 800,000 non-essential federal employees across the country were out of work without pay, while about 1.3 million essential employees reported to work as normal (though they saw their paychecks delayed). At the heart of the potential 2018 shutdown is the political debate surrounding immigration policy, though the effects on government workers would likely be largely the same as in 2013.

Source: International Business Times
While these numbers account for the vast amount of federal employees furloughed outside of Washington DC (such as employees in National Parks across the country), they still included a large number of DC residents. Further, employees of government contractorswere reportedly sent home and furloughed without pay as well, though the data surrounding exactly how many government contracts were affected is unclear. So while there are other metropolitan areas that have a larger percentage of their workforce employed by the federal government, the prominence of federal contractor workers in DC still makes it an obvious choice for examining how the electricity demand changed in the wake of the 2013 federal government shutdown. More importantly, though, this analysis will focus on Washington DC because the data from the power companies is available in a sufficiently granular way for the region. The Potomac Electric Power Company, or PEPCO, is the electric power company that serves the entire city of Washington DC, as well as the surrounding communities in Maryland, so looking at PEPCO’s data over the shutdown dates will enable insights into the effect of the shutdown. Federal workers in other regions are typically served by much larger power companies (such as Dominion Energy in Virginia serving many of the Northern Virginia communities of federal workers in addition to the rest of Virginia and parts of North Carolina), making the potential effect on the power delivery data from the shutdown less significant on a relative scale.
Data and graphics
PJM, the regional transmission organization that coordinates the movement of wholesale electricity in 13 states and DC, makes available PEPCO’s metered electricity load data on an hourly basis. This type of data is available for most U.S. power companies, which is fun to play with to get an idea of how Americans behave during certain events like holidays, the Super Bowl (check out this post analyzing Super Bowl Sunday electricity use), or any other large-scale event. In order to get a baseline of what the weekly electricity distributed by PEPCO, we can first look at the two weeks leading up to the government shutdown of 2013:

A couple trends become clear looking at these two seemingly normal weeks. First, the weekends (with Saturday and Sunday graphed using a dashed line instead of the solid line for weekdays) appear to have less electricity demand compared with weekdays. This trend is noted everywhere, not just DC, as weekends are when typical commerce activity drops. Additionally, there are clearly patterns of high and low electricity use by time of day, regardless of weekend or weekday. Demand appears to be at the lowest late at night and early in the morning when most people are sleeping, ramp up in the morning as people wake up to begin their day, and peaks around 5 PM when people are coming back home, making dinner, turning on the TV, putting laundry in the washing machine, etc. But did any of these trends change during the 2013 federal government shutdown? Here is the same data for the three calendar weeks during which the government was shut down:

When comparing these graphs with the two weeks prior, there does seem to be some noticeable differences– though the differences vary between the three weeks the shutdown was effective:
First Week
To start, the peak and cumulative power use appears to have increased a significant amount during the first week of the shutdown– though that could always be caused by the weather and a need to increase air conditioning or heating in a home. Indeed, looking at the temperature (discussed more later), the average temperature during the week climbed from about 66 degrees Fahrenheit the week before to about 73 degrees Fahrenheit. A possible explanation is the higher power use coming from people turning on their AC for the first time in a while due to unseasonably warm temperatures.
The overall ‘shape’ of the curves remain constant, so the furloughed employees and contractors did not appear to change their daily patterns enough to shift the timing of peak and minimum electricity loads.
Also interesting to note is that the Sunday before the shutdown (Sep. 29) stays lower than the weekdays, as was noted to be typical of weekend days, but the Saturday following the shutdown (Oct 5) then shifts to be among the days with the greatest electricity demand. I wasn’t expecting the furloughing of employees to have much of an effect on the weekend electricity demand, as most of the furloughed federal employees presumably did not typically work on weekends, but the answer can likely be attributed to weather as the weekend of Oct 5-6 had the warmest temperatures (79 and 80 degrees Fahrenheit, respectively) of the whole analysis period.
Second Week
The second week is the most anomalous of the three, with Sunday and Monday having the shape of the curve significantly affected and also having much higher peaks than the rest of the week (whereas the first week increased the peaks more comparably among the days of the week). In terms of why Sunday might have shifted so significantly, a search of what might have happened in Washington DC to cause this change on October 6, 2013 turned up an article about an explosion accident on the Metro. Perhaps the emergency response to this incident caused significant effects to the electricity demand?
Outside of Sunday and Monday, the peaks and shapes of the demand curves were back to being comparable to pre-shutdown levels. As will be shown shortly, though, this trend looks to be attributable to the returning of temperatures to an average of 65 degrees Fahrenheit.
Third Week
By the time of the third and final week of the shutdown, the electricity demand curve looks to be mostly back to normal. The last Sunday of the shutdown and the first Saturday after the shutdown look like normal weekend days, while the weekday curves look normal all week, even though the furloughed government employees and contractors did not head back to work until Thursday.
Just to be complete and ensure the trends we saw before and during the 2013 federal government shutdown were not just random week-to-week variations, below are the same graphs for the two weeks following the shutdown:

These two weeks show somewhat the same general trends we saw prior to the shutdown, with the main changes being that the peak demand for each day appears to be shifted to first thing in the morning when people are waking up and the morning of Saturday Oct 26 showing a higher peak than is typically expected of a weekend day. The peak electricity demand shifting to the morning likely comes from the weather getting colder (down to average temperatures of 53 and 59 degrees Fahrenheit, respectively), while the early peak electricity demand on Saturday Oct 26 might have been caused by a rally protesting mass surveillance that attracted thousands of people to Washington DC (though it too is likely in part due to the fact that it was the first day of the season where the average daily temperature dipped to 46 degrees Fahrenheit and people cranked the heat up when they woke up shivering that Saturday morning).
In addition to the demand curves, it’s important to look at the total daily electricity consumed by day over these previously discussed weeks, while also comparing these totals to the average daily temperatures in DC as I’ve done through the previous analysis:

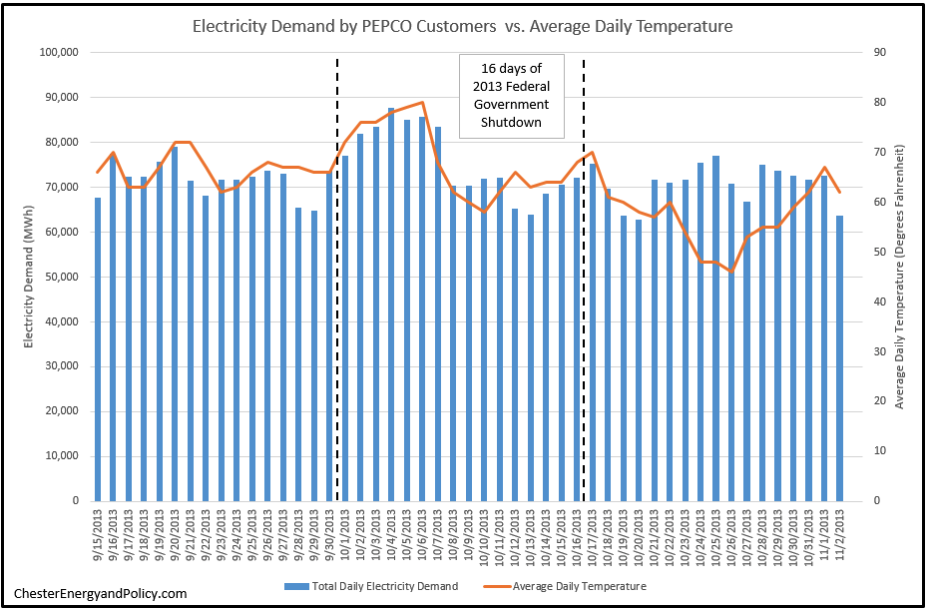
As these two graphics demonstrate, the total electricity demand mostly moves step-in-step with the daily weather regardless of whether or not the federal government is open. If it gets too warm or too cold, that is when you see the spikes in electricity demand– and that will always be the most significant factor.
Conclusions
In the end, there does not appear to be a significant effect on Washington DC’s electricity demand during a federal government shutdown. While having thousands of employees and contractors stay at home is certainly not trivial, there are still even more government employees who would be deemed ‘essential’ and would be in the federal buildings (who would still be operating their heating/cooling systems). Beyond that, a vast majority of PEPCO customers are not in the federal workforce, so the change in daily habits of the unfortunately furloughed employees does not move the needle in a noticeable manner in terms of electricity demand. What’s more important to consider is the weather, and perhaps any daily events such as the Metro accident or the anti-surveillance rally. So while no one, especially in DC, is rooting for a federal government shutdown this week (the 2013 shutdown cost the country $24 billion and disrupted Veterans Affairs benefits from being sent out), we can take incredibly small solace that it won’t disrupt the expected electricity demand. Despite liquor sales increasing during the 2013 shutdown, the thousands of workers who would find themselves temporarily out of work would not have their change in daily routine threatening the electrical grid’s behavior.
If this type of data is of interest to you, by the way, the Energy Information Administration has an amazing tool that allows you to track electrical demand across the country in real-time. Are there any other events you think would be interesting to investigate for their effect on electricity demand? Let me know in the comments!
If you enjoyed this post and you would like to get the newest posts from the Chester Energy and Policy blog delivered straight to your inbox, please consider subscribing today.
To see other posts taking deep dives into energy data, see this post on electricity demand on Super Bowl Sunday, this post analyzing economics issues surrounding clean coal, this post on data of all U.S. wind turbines, and this primer on how to use data from the Energy Information Administration.
Sources and additional reading
Absolutely everything you need to know about how the government shutdown will work: Washington Post
Customer Base Line: When do you use the most electricity? Search for Energy
Demand for electricity changes through the day: Energy Information Administration
Democrats face make-or-break moment on shutdown, Dreamers: Politico
Electricity supply and demand for beginners
Everything You Need to Know About the Government-Shutdown Fight: New York Magazine
Here’s What Happened the Last Time the Government Shut Down: ABC News
How Many Federal Government Employees Are in Alexandria? Patch
U.S. Government Shutdown Looms Amid Immigration Battle: Reuters