Answering the Internet’s Pressing Solar Questions Using The Open PV Project

This article is a rehosting of the full article that first appeared in Solar Tribune, a solar news, education, and advocacy website where I contribute as a featured writer.
While solar power continues its accelerated adoption in the U.S. market, the National Renewable Energy Laboratory (NREL) tracks photovoltaic (PV) installations nationwide. As the sector evolves, this tool provides invaluable access to public data.
The Open PV Project, run and operated by NREL, tracks and makes publicly available such solar data and provides vital information for any stakeholders across the solar energy industry. The dataset is undoubtedly massive, so a first glance proves intimidating. However, digging through Quora for the most common type of questions about the solar industry provides the ideal opportunity to walk through the data for anyone (even those who aren’t experts in solar) on how to take advantage of such a valuable resource.

Source: Ridge
What is The Open PV Project?
As stated on the dataset’s homepage:
The Open PV Project is a collaborative effort between government, industry, and the public that continues to compile a database of available public data for photovoltaic (PV) installation data for the United States. Data for the project are voluntarily contributed from a variety of sources including solar incentive programs, utilities, installers, and the general public.
NREL’s data represents the best crowdsourced resource to identify the country’s solar installations, both large and small. NREL, one of the laboratories under the umbrella of the U.S. Department of Energy, offers this information to the public to help people, government entities, and industry to understand past and current trends of the U.S. PV industry.
Keeping the data complete, up to date, and accurate is critical for The Open PV Project to retain its value, so NREL notes that data are collected from all contributors willing to offer data– including state-run incentive programs, utilities, PV businesses and installers, solar advocacy organizations, consumers, and more.

Source: NREL
Exploring the dataset
When opening The Open PV Project, the homepage you’ll find appears as follows:
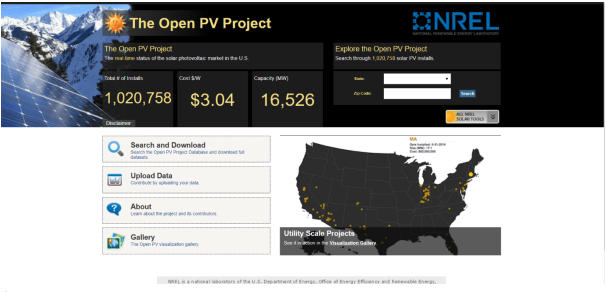
Source: NREL
Users have the option to “Search and Download” the data, “Upload Data” to contribute information, learn “About” the project, and see some of the visualizations created with the data in the “Gallery.” For the purposes of learning how to use this data yourself, let’s step through the “Search and Download” option.
Search and Download
The Search page appears as follows:

Source: NREL
From here, you can search the dataset in the browser, download the full dataset for your own review, or download Lawrence Berkeley National Laboratory’s Tracking the Sun report that summarizes the important trends in the data for you. But, to answer specific questions you may have, you’ll likely have to search through the data yourself.
The “Solar Search” option allows you to zero in on the type of solar installations in which you’re interested. This option can be particularly useful if you want a quick answer to questions such as “How much solar capacity was installed in Virginia since the beginning of 2016?” Simply fill out that criteria and find the following view:

Source: NREL
As we can see in the top right corner of the screen, this dataset includes 25 such installations for a total capacity of 1.39 megawatts (MW) with an average cost of $2.75 per watt (W). You can also download the information for each of the relevant installations to analyze them in more detail yourself. This “Solar Search” option is ideal if your question is brief and only concerns the criteria of: state, zip code, size, date of installation, or contributor.
However, the full data include many more details to sort through, so more in-depth questions will require you to download the full Open PV Dataset. To explore through the full data, click the download button, but be forewarned– this dataset has over one million entries and the file is a behemoth. Make sure you’re on a computer that can handle processing such a large file before diving in.
In collecting this completed dataset, NREL encourages contributors to include as much information as they have and find relevant, with categories including (but not limited to) the following:
State/city/county/zip code
Date installed
Incentive program used
Type of installation
Size, in kilowatts (kW)
Installation type (e.g., residential, commercial, or utility)
Installer
Cost per watt
Total cost
Annual production
Not every entry includes data for each category– the only data fields required to be filled out are date installed, size, location, and total installed cost (before any incentives).

Source: SEIA
Answering Quora’s pressing solar questions
To prove how useful this dataset can be, I’ll now answer some of Quora’s most pressing questions on the solar industry using just the information found on The Open PV Project (same as I did for answering Quora questions using the U.S. Wind Turbine Database). For those unfamiliar, Quora is an online question-and-answer resource where community members can seek out answers from experts to any question, with the top answer often ending up the top result on Google when someone asks the same question.
Equipped with the invaluable information from The Open PV Project, we can now provide the solar industry answers demanded by the Quora community:
Which U.S. state has the most solar powered homes?
This question is exactly the type that The Open PV Project was built to answer. By downloading the full dataset and filtering so only the residential installations are shown, we’re still left with over 908,000 entries from the original 102,000,000 entries, but where are those residential installations focused? By sorting the 908,000 residential installations by state, we get the following top 10:
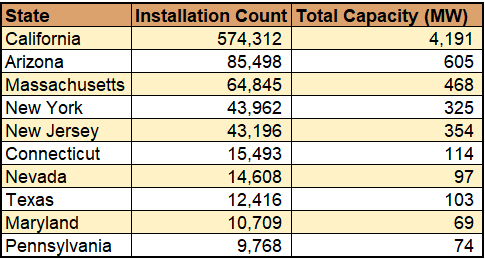
California is head-and-shoulders above the rest of the country with almost 600,000 residential solar installations for over 4,000 MW. Other states in the Southwest join California in the top 10 of residential solar, including Arizona, Nevada, and Texas. The Northeast joins as the other region of the country highly represented, with large solar installation counts in Massachusetts, New York, New Jersey, Connecticut, and Pennsylvania.
We must consider, though, that some of these states might only fall in the top 10 because they are populous states. To check for that, we can factor in each state’s population to find the top 10 states in per capita installations:

As this list shows, many states are represented in the top 10 when calculated on a per capita basis. Even though California is so populous, they are still kings based on one residential solar installation for every 69 residents. However, Texas, New York, Maryland, and Pennsylvania fall out and are replaced with Delaware, Washington DC, New Mexico, and New Hampshire, who are each doing more with their smaller populations.
Why are there no solar panels installed on the Southwestern deserts?
Answering this question shows how publicly accessible datasets like The Open PV Project represent an opportunity to quash misinformation. Assuming this question is asking why the deserts of the American Southwest, with their abundant sunshine, are not being utilized for utility-scale solar power, then a quick analysis shows that there in fact are plenty of solar panels in these areas.
The Southwest almost always refers to Arizona and New Mexico and can also include California, Nevada, Utah, Colorado, Texas, and Oklahoma, depending on the context and who you ask. Given these states, a quick analysis of the data shows the following count of utility installations across the Southwest states:

Based on this, we can see that most of the states do indeed utilize their solar resources on a utility scale, and in fact they’ve done so for going on a decade or longer. But the person who asked this question is correct to ask why more isn’t being done, particularly in Utah and Oklahoma where no utility installations of solar are recorded.
Are solar installations expensive?
After questions about the prevalence of different types of solar installations, the other most common inquiries are those asking about the costs. This question gets straight to the point, asking if solar installations are expensive.
Such a broad question cannot be answered with a simple yes or no, but The Open PV Project provides us with the necessary data to describe cost trends. Focusing on the three most common installation types– residential, commercial, and utility– the range of total system costs are shown in the following table:

Overall, residential systems appear the least expensive and utility the most expensive. Such a trend is unsurprising, as residential systems are typically the smallest, with commercial installations somewhat larger and utility-scale solar by far the largest. To gain further insight, we can look at the cost per watt information in the dataset:

Based on the more informative cost-per-watt numbers, we can see that residential and commercial systems tend to be about the same price, as they use the same rooftop solar technologies. Utility-scale installations, though, are somewhat more expensive because they are not simple rooftop installations, but rather full-fledged power generating sites that must include additional features– cooling considerations, transmission and distribution systems, etc. However, those additional features reportedly do lead to higher utilization rates and capacity factors, meaning the ultimate cost for electricity generation is more economic for utilities than for residential or commercial operations. However, all types of solar are already cheaper than new fossil fuel generation projects in many parts of the United States.
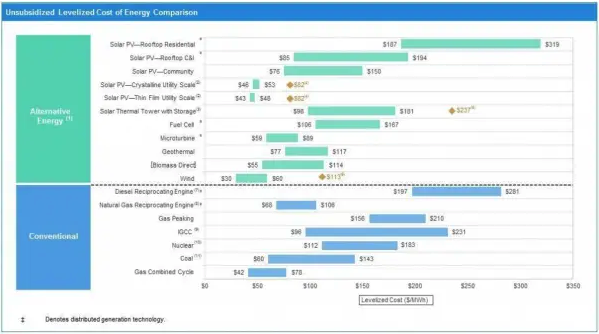
Source: Energy Innovation
Not only does The Open PV Project elucidate the affordability of installations, but we can also plot the data over time to see how prices have evolved:

As is evident from the scattering of data points, much goes into the determination of a solar installation’s cost– factors such as size, location, installer, and unique aspects of the rooftop. Thus, coming up with a one-size-fits-all answer to “How expensive are solar installations” is difficult. But the trend lines do demonstrate that, on the whole, the cost per watt of solar is consistently falling across these three most common sectors. The dataset would also let you separate data to see what trends pop up across different regions, time periods, rebate programs, and more. But I can’t have all the fun on my own, so dive into the data for your own analysis.
But in short: solar installations do have significant upfront capital costs, but those prices are dropping and becoming cheaper than other conventional energy generation sources. For residential and commercial installations, solar typically pays for itself in six to eight years through energy savings, with all savings after that point pure profit.
What’s the average cost of a 2-kilowatt solar installation?
Ending with a narrower question, this person wanted to specifically know how much a 2 kW solar system would cost. To answer the question we can focus on all entries of the dataset within 10% of 2 kW, of which there 32,788 installations (88% of which are residential, so we can also narrow our view into those entries since the person asking is likely asking about such residential systems).
Graphing the total system costs of residential solar installations between 1.8 kW and 2.2 kW gives the following:

Unsurprisingly, given our previous findings, the costs have been trending downward but remain spread over a wide range. Across data from The Open PV Project, the price range of ~2 kW residential solar installations extends from $1,800 (1.8 kW system installed in 2015 in California) to $62,608 (2.1 kW system installed in 2010 in Arizona). On average, 2 kW residential solar systems cost $13,968. To demonstrate how that’s changed over time, though, note that from 2000 through 2009 the average 2 kW system cost was $17,317 and that average cost over 2010 through 2018 fell to $12,540.
As you can see, The Open PV Project makes available countless opportunities for everyone to analyze the U.S. solar industry. The only question left is: what questions will you find the answers to next?