Fantasy Energy League Draft Follow-Up: Long Shots, Dark Horses, and Sleeper Picks from the Final Rounds
In this final recap of the Fantasy Energy League Draft, it’s time to examine the leftovers. Picks in the first three rounds revealed the priorities of each of the teams, but these last two rounds find league members picking up the scraps of the sectors they’d neglected to this point and after the most obvious choices were already taken.
But that’s not to say there isn’t a lot of intrigue and strategy to this round. In fact, the pursuit of late-round sleeper picks was made particularly intriguing by the introduction of the wildcard factor. As a reminder of that rule, the pick among each team’s roster of five that sees the greatest year over year percentage drop will represent that team’s wildcard factor. When scoring up the total aggregate emission drop of each team (the entire goal of this game), the total will be bumped up by this percentage drop. This wrinkle means teams can spend their late round picks not necessarily looking for the states with the greatest aggregate drop in emissions but the greatest percentage drop to nap that high wildcard factor. So, perhaps a small state with an aggregate drop in emissions that wouldn’t tip the scales otherwise will come into play thanks to its wildcard potential? Let’s find out!
Round 4 Review
Pick 4.1 from The Windy City: Louisiana Transportation Sector
Pick 4.2 from Energy Innovation: North Carolina Commercial Sector
Pick 4.3 from This CO2 Shall Pass: Maryland Transportation Sector
Pick 4.4 from Kiterocket Renewables: Massachusetts Residential Sector
Pick 4.5 from Powerhouse: Massachusetts Transportation Sector
Pick 4.6 from Good Wind Hunting: Ohio Transportation Sector
Pick 4.7 from GridLab: Connecticut Transportation Sector
Pick 4.8 from Clarion Energy Women in Power: California Transportation Sector
Pick 4.9 from Emission Impossible III Carbon Protocol: Iowa Commercial Sector
Pick 4.10 from Electrowinning: Michigan Commercial Sector
Pick 4.11 from CELI: Tennessee Commercial Sector
Pick 4.12 from Rocky Mountain Institute: Arizona Commercial Sector
Pick 4.13 from ELECTRIFIED Planes, Trains, and Automobiles: Missouri Commercial Sector
Pick 4.14 from New Energy Equity: Minnesota Commercial Sector
So, what are the takeaways from Round 4? Commercial sector picks led the round with 7 selections, followed by transportation at 6 picks and residential with 1. At this point, all teams already locked up their electric power sectors and all but two had their industrial sector, so it makes sense that these are the sectors left from which to choose. But the selections of commercial as the leader here are interesting given that it was the last sector to have anyone pick it for the first time, and yet many teams still opted to leave transportation and residential sectors until the last round. Perhaps this trend is due to a fear that the transportation emissions are actually increasing in some states, while the smaller starting point of commercial compared with residential mean that’s more likely to strike in the wildcard factor?
Aside from that, though, teams are undeniably all over the board here. Geographically, selections stretch from Louisiana up to Massachusetts and from coast to coast via Maryland and California. In terms of size, the small Iowa commercial sector contrasts the massively sized California transportation sector. Teams are definitely diverging in their strategies and pathways, which is why doing this Fantasy Energy League has proven to be an interesting academic exercise. Which strategy is right? And which states and sectors are out teams betting on (at least in 2017) to do the most to stave off climate change?
Round 5 Review
Pick 5.1 from New Energy Equity: Virginia Transportation Sector
Pick 5.2 from ELECTRIFIED Planes, Trains, and Automobiles: Ohio Residential Sector
Pick 5.3 from Rocky Mountain Institute: Wisconsin Transportation Sector
Pick 5.4 from CELI: Louisiana Industrial Sector
Pick 5.5 from Electrowinning: Wyoming Transportation Sector
Pick 5.6 from Emission Impossible III Carbon Protocol: West Virginia Transportation Sector
Pick 5.7 from Clarion Energy Women in Power: Florida Residential Sector
Pick 5.8 from GridLab: Michigan Residential Sector
Pick 5.9 from Good Wind Hunting: North Carolina Industrial Sector
Pick 5.10 from Powerhouse: Oregon Residential Sector
Pick 5.11 from Kiterocket Renewables: District of Columbia Transportation Sector
Pick 5.12 from This CO2 Shall Pass: Illinois Commercial Sector
Pick 5.13 from Energy Innovation: New Mexico Transportation Sector
Pick 5.14 from The Windy City: Kentucky Commercial Sector
Wrapping up the draft in this fifth round, we see the selection of 6 transportation sectors, 4 residential sectors, 2 commercial sectors, and 2 industrial sectors for a bit more variety. Here we again see the pattern of picks diverge, showing perhaps people taking more shots in the dark amid the uncertainty, and maybe some candidates for leading wildcard factors? When we look at how these selections rank in 2016 data compared with other states, though, we find the following:
Of the 6 transportation sectors selected, 4 (DC, WY, WV, and NM) are in the bottom 15, 1 (WI) is in the middle of the pack, and the other (VA) is in the top 15 in terms of most CO2 emissions in a state transportation sector.
Of the 4 residential sectors selected, 2 (MI and OH) are in the top 6 most residential emissions in the nation, 1 (OR) is in the middle of the pack, and 1 (FL) is in the bottom 6.
Of the 2 commercial sectors selected , 1 (KY) is in the middle of the pack and the other (IL) is in the top 3 for total state commercial sector emissions.
Of the 2 industrial sectors selected, 1 (NC) is middle of the pack and the other (LA) is in the top 2 in industrial emissions.
So, a range of strategies and a wide variety in picks, with not as many people aiming for that wildcard factor as I might have expected (though I see you, DC transportation and FL residential picks, I see you).
Looking Ahead
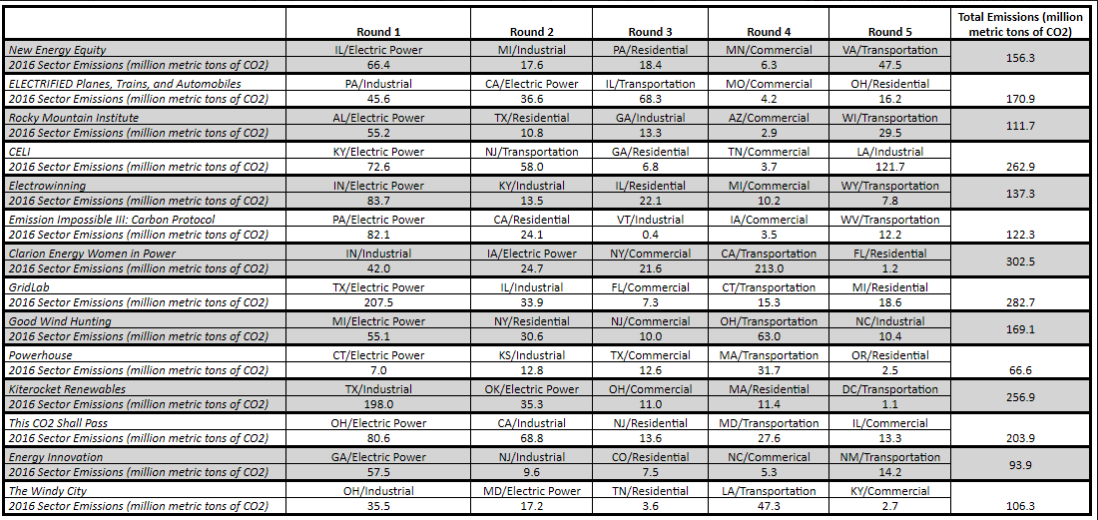
Now that I’ve finally dropped my Fantasy Energy League Draft reviews, we can prepare for what the conclusion will look like! To start, here’s a table that summarizes the draft and every team’s pick in one nice, shareable graphic:
And here’s that same graph that displays the starting point emissions for each selection, that is the emissions recorded in the EIA data in 2016 (remember, the goal is for each team to assemble a roster that will see the greatest year-over-year emissions reductions from 2016 to 2017):
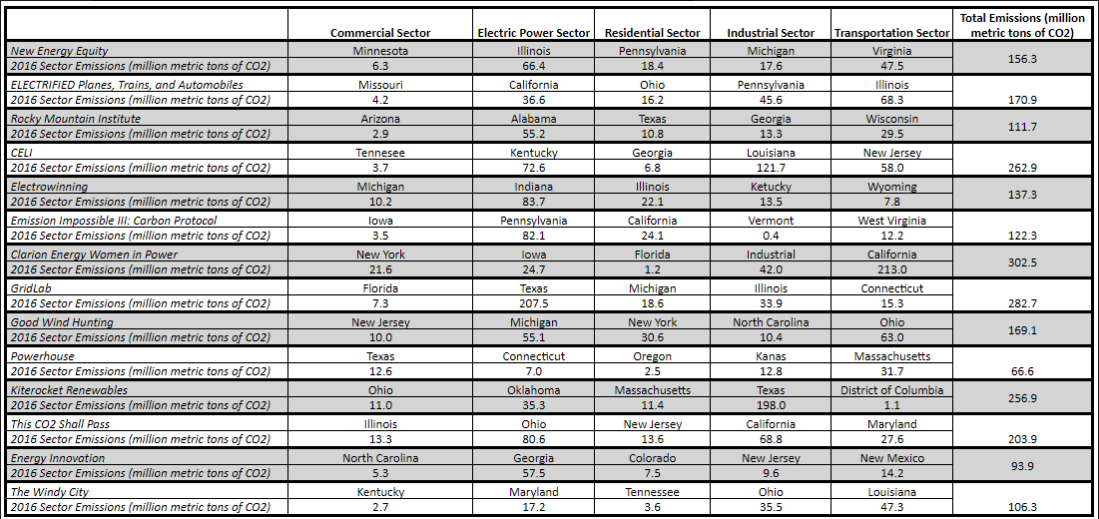
And rearranging that table so each sector can be compared in the same column…
Our starting points have a great amount of variety in them, as low as Powerhouse starting with 66.6 million metric tons of CO2 (which is itself outpaced by more than a magnitude of two by TX/Electric Power, CA/Transportation, and LA/Industrial) all the way up to our most carbon-emitting roster of nearly 303 million metric tons of CO2 from Clarion Energy Women in Power. In individual picks, they go as low as 0.4 million metric tons for VT/Industrial (is this Emission Impossible III’s play for a game-changing wildcard factor?) and as high as 213 million metric tons for CA/Transportation (hopefully Clarion Energy Women in Power is confident in 2017 sales of electric vehicles!).
As an unbiased commissioner, I’ll refrain from declaring a favorite, especially since we only need to wait for the release of EIA numbers for 2017 emissions in October of this year. But that doesn’t stop you, reader, from making a pick! Whose team do you like best? Which team is a train wreck? And what do you think should be the prize for the inaugural winner of the Fantasy Energy League? Let’s discuss in the comments below and on Twitter!


